 Charles Siegel of Rigorous Trivialities ran a great series on big theorems.
The series started january 10th 2008 with a post on Bezout’s theorem, followed by posts on Chow’s lemma, Serre duality, Riemann-Roch, Bertini, Nakayama’s lemma, Groebner bases, Hurwitz to end just before christmas with a post on Kontsevich’s formula.
Also at other blogs, 2008 was the year of series of long posts containing substantial pure mathematics.
Out of many, just two examples : Chris Schommer-Pries ran a three part series on TQFTs via planar algebras starting here, at the secret blogging seminar.
And, Peter Woit of Not Even Wrong has an ungoing series of posts called Notes on BRST, starting here. At the moment he is at episode nine.
It suffices to have a quick look at the length of any of these posts, to see that a great deal of work was put into these series (and numerous similar ones, elsewhere). Is this amount of time well spend? Or, should we focus on shorter, easier digestible math-posts?
What got me thinking was this merciless comment Charles got after a great series of posts leading up to Kontsevich’s formula :
“Perhaps you should make a New Years commitment to not be so obscurantist, like John Armstrong, and instead promote the public understanding of math!”
Well, if this doesn’t put you off blogging for a while, what will?
So, are we really writing the wrong sort of posts? Do math-blog readers only want short, flashy, easy reading posts these days? Or, is anyone out there taking notice of the hard work it takes to write such a technical post, let alone a series of them?
At first I was rather pessimistic about the probable answer to all these questions, but, fortunately we have Google Analytics to quantify things a bit.
Clearly I can only rely on the statistics for my own site, so I’ll treat the case of a recent post here : Mumford’s treasure map which tried to explain the notion of a generic point and how one might depict an affine scheme.
Here’s some of the Google Analytics data :
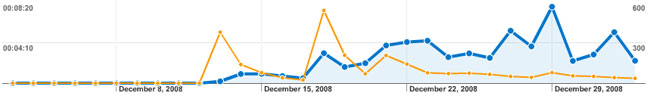
The yellow function gives the number of pageviews for that post, the value ranges between 0 and 600 (the number to the right of the picture). In total this post was viewed 2470 times, up till now.
The blue function tells the average time a visitor spend reading that post, the numbers range between 0 and 8 minutes (the times to the left of the picture). On average the time-on-page was 2.24 minutes, so in all people spend well over 92 hours reading this one post! This seems like a good return for the time it took me to write it…
Some other things can be learned from this data. Whereas the number of page-views has two peaks early on (one the day it was posted, the second one when Peter Woit linked to it) and is now steadily decreasing, the time-on-page for the later visitors is substantially longer than the early readers.
Some of this may be explained (see comment below) by returning visits. Here is a more detailed picture (orange = new visits, green=returning visits, blue=’total’ whatever this means).
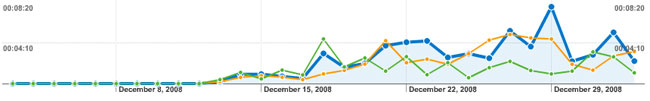
All in all good news : there is indeed a market for longer technical math-posts and people (eventually) take time to read the post in detail.
6 Comments