Google analytics is collecting data on this site for over a month now. Perhaps it is time to share a few lessons Ive learned over this period.
UPDATE : I have de-activated all google analytics plugins on this site. I may re-activate them for short periods later but ONLY to detect problems or to check on plugin performance. I will announce this in the sidebar with a ‘this site contains google analytics script code’-sticker. I encourage people using google analytics stalking code to do the same.
1. Aim at the generic visitor, not the specific
Analytics offers an amazing amount of data, in debatable detail. For example, via the map-overlay one can zoom in to specific towns and communities. When combined with other data, such as new/returning visitors etc., this quickly becomes borderline stalking. So, repress that urge to check-out whether someone you know is reading your blog, and how often, and how long, and how deep, and … Use analytics only to get an idea of what the generic visitor does with your site.
2. There is a world outside your blog
Don’t get obsessed by analytics-data and, certainly, do not feel that you have to react to it, all the time! For example, below the evolution of the number of visitors coming here over the last month
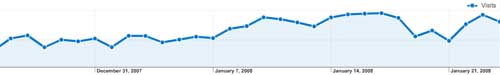
The dramatic fall in attendance from last friday until this monday might have worried me (when obsessed). However, a quick check gave a similar drop for the number of new visitors and the number of search-engine referrals. Probably, people were, at that time, more interested in the stock-market-crisis than in this blog… Besides, most people visiting here come from the US and I learned that they had a Luther King vacation day, so perhaps lots of them enjoyed a prolonged week-end, away from their computer.
3. Detect & correct major, lasting changes
So, forget about temporary blips. However, when a certain trend has every indication of becoming permanent, it might be the moment to check out what is going on. Below the bounce rate-evolution over the last month
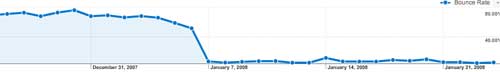
This is what you might call a lasting drop! Fortunately this time I knew what was going on, because of the actions described in the bounce rate post. But, when you detect a similar drop in certain stats it is time to figure out the causes. Perhaps you de-activated by mistake a certain plugin (see below), or something is wrong with your server, or…
4. Check-out plugin performance
There are tons of WordPress plugins, some useful, some less. So it is best to check whether activating a plugin has the desired effect. For example, you should be able to detect installation of an SEO-plugin (for, Search Engine Optimalization) in the Traffic Sources/Search Engines graph, installing and using a tagging-plugin should give you more referrals from Technorati and look-a-likes, etc.
5. Don’t take it too seriously
You can use analytics data just for fun! For example, do a quiz, show visitor-data and ask for global events explaining the graph (as above). Or notice quirks in your data. For example, here the time-on-site graph over the last month
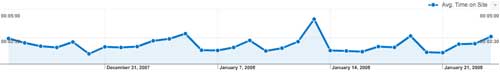
My generic visitor seems to have a cyclic attention-span…
7 Comments